Along diffusion modeling and model estimation from diffusion MRI (see this page for more information), some major steps need to be achieved to be able to actually use advanced diffusion models in clinical studies, and provide benefit from these advanced models. Another part of my research therefore focuses on two aspects of this processing: image quality improvement, and performing operations on these complex models.
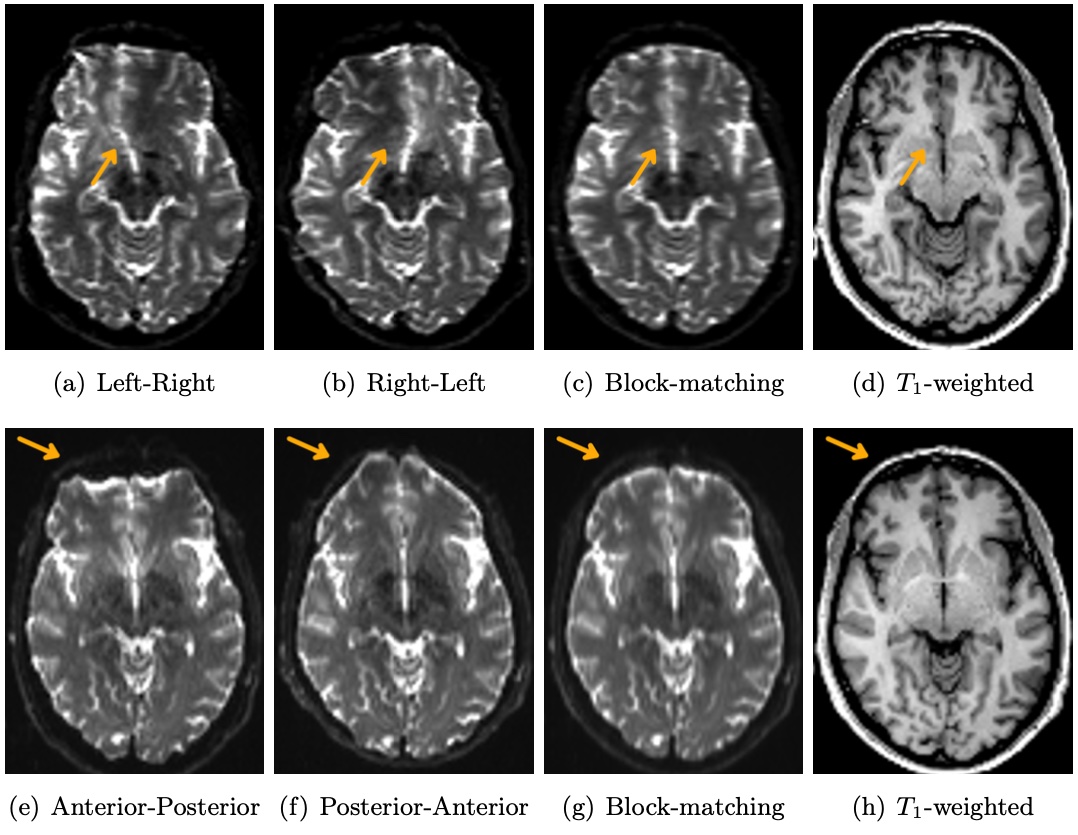
The first part of my research thus concerns image improvement. Raw diffusion images are indeed corrupted by many artefacts including the so-called susceptibility induced distortion, caused by magnetic susceptibility differences at the interfaces between tissues (see Fig. 1). I am actively studying how to correct for these effects using in particular registration based approaches. I am other doing research on how to correct for motion between scans in particular in scans of babies where movement is a major problem.
|
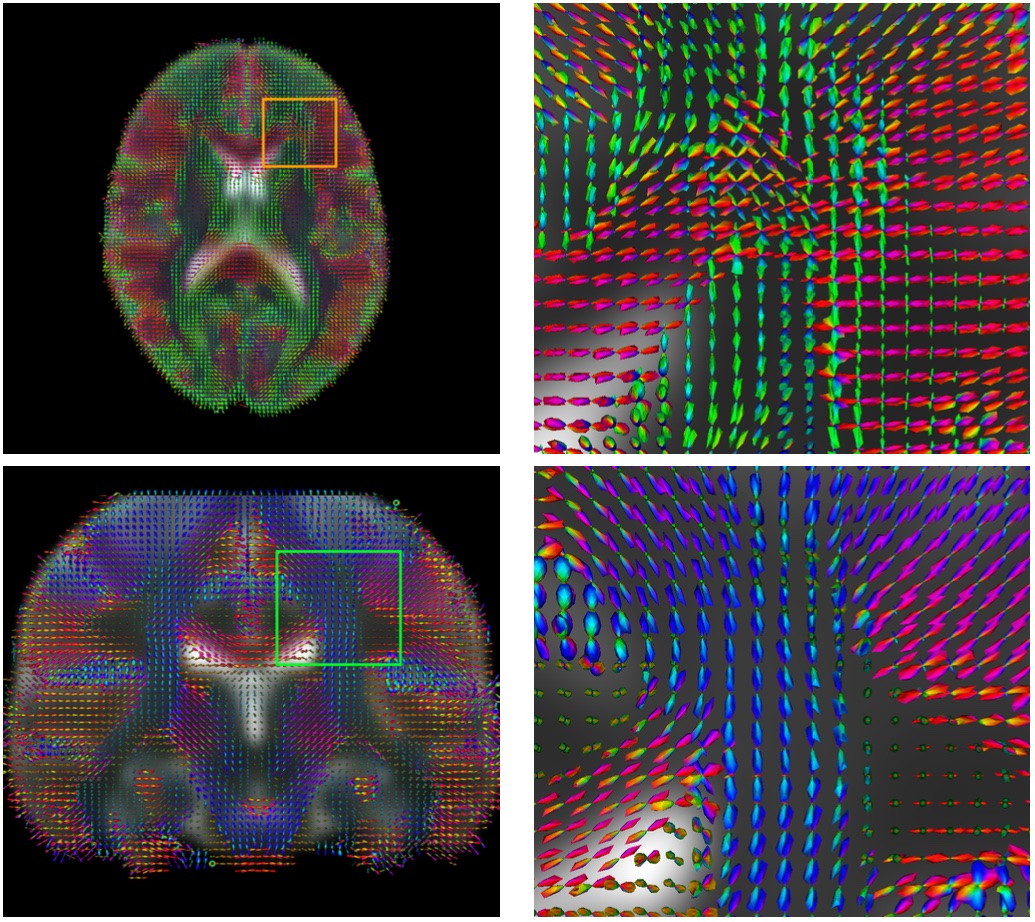
The second area of research is the application of what could be simple operations, such as interpolation or registration, to multi-compartment model images. Due to the nature of these images where each voxel is composed of a complex model, doing even interpolation and even more registration or atlas construction, is rendered a very complex task. I am thus researching actively how to perform these operations, with a particular focus on considering the model as generic as possible, since so many different compartment types have been described in the literature. Examples of atlases obtained using the currently developed methods are illustrated in Fig. 2.
|
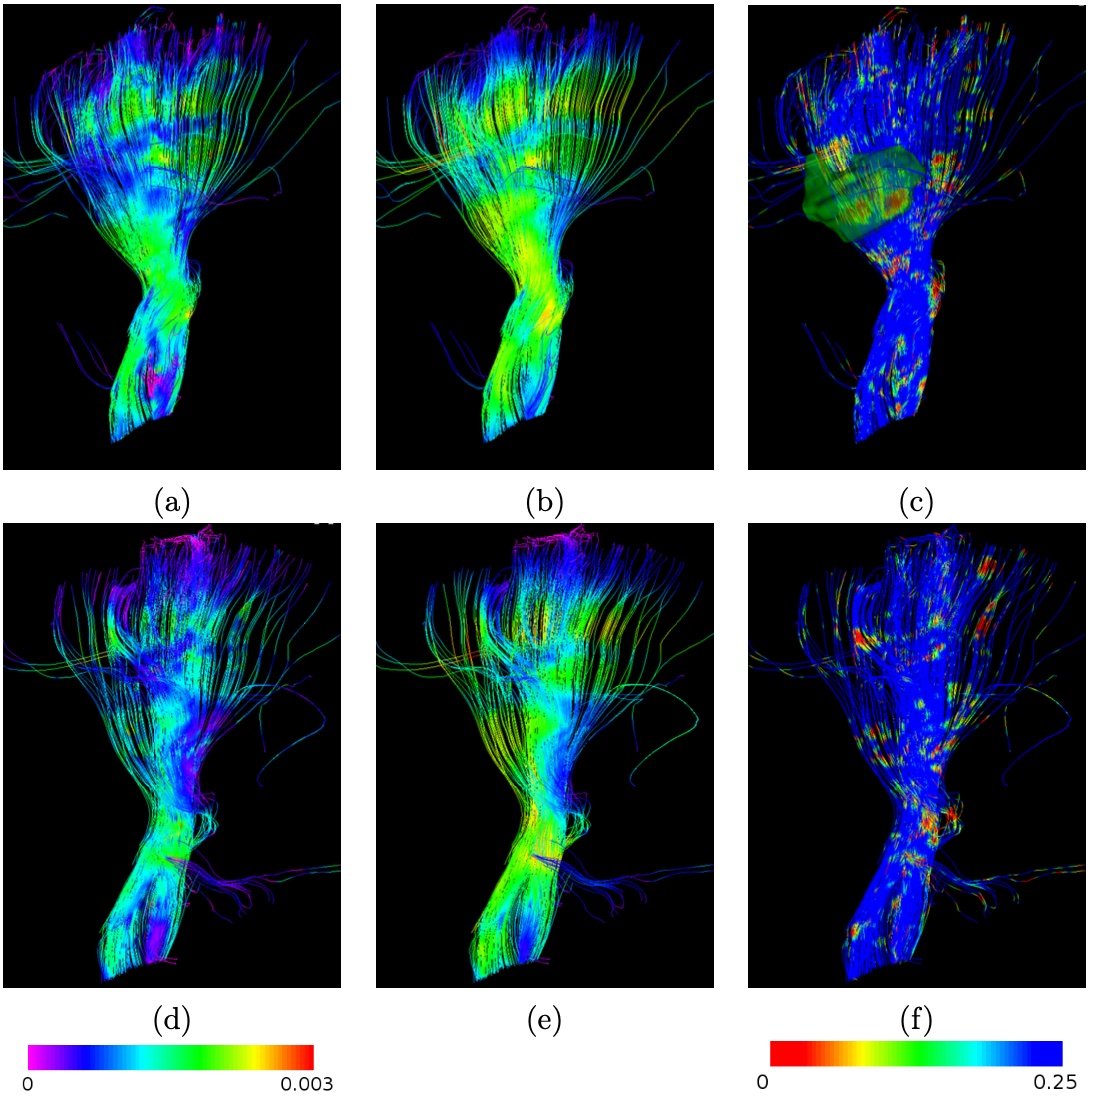
Finally, in the direct line of these works, I have been researching ways to use those registered model images, together with advanced tractography algorithms, to explore the disease burden invarious pathologies including multiple sclerosis. See Fig. 3 for a preliminary illustration of along fibers statistics we may perform on a specific patient.
|