Head and neck atlas-based segmentation for the automatic delineation of critical structures demonstrated very promising results in [1]. However, the construction of the atlas is very difficult due to the high variability of the anatomies of the patients. This can therefore generate over-segmented structures in the atlas, leading to an over-segmentation of the patient structures.
To overcome this drawback, we are highly interested in the construction of an atlas whose anatomy is as similar as possible to the patient to delineate. Moreover, we are also interested in obtaining efficient methods so that they can be used in clinical routine easily.
A. Efficient Selection of the Most Similar Image in a Database
We have presented in [2] an efficient method to find the most similar image in a database to the patient to be delineated. This process is illustrated in Fig. 1.
This method is based on the use of the average atlas as an intermediate reference. The transformations \( T_{M \rightarrow I_k} \) from each image \( I_k \) of the database to the mean atlas \( M \), obtained from the atlas construction, are compared with the transformation \( T_{M \rightarrow P} \) obtained when registering the patient \( P \) on the atlas. The most similar image is then chosen as the one that minimizes the distance between its transformation and the one of the patient, i.e.
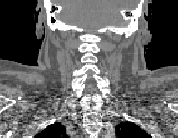
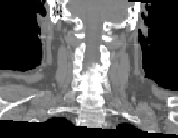
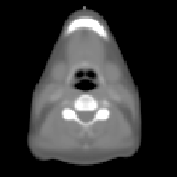
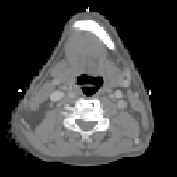
\begin{equation} \DeclareMathOperator*{\argmin}{arg\,min} \tilde{I} = \argmin_{I_k} d(I_k,P) = \argmin_{I_k} \| T_{M \rightarrow P}^{-1} \circ T_{M \rightarrow I_k} - \mathrm{Id} \| \end{equation}Fig. 2 shows the most similar image selected for a corpulent patient compared to the mean atlas image. The anatomy of this image is much closer visually to the patient to be segmented and the transformation bringing it on the patient is therefore a priori easier to compute.
|

|
 |
||
| (a) | (b) | (c) | ||
 |
 |
 |
||
| (d) | (e) | (f) | ||
B. Going Further, a Locally Most Similar Atlas To a Patient: Analogy to the Frankenstein's Creature
The method proposed above has shown very interesting results, allowing to compute a globally similar atlas to the patient. However, the image selected as the template may not be locally the most similar to some regions. It was therefore of great interest to study the extension of this method to the local selection of the most similar images to the patient.
To this end, we have presented in [3] the extension of the selection method to local regions predefined on the average atlas and corresponding to the regions that are to be delineated in the patient. This allows us to get a set of images \( I_l \) that are the most similar to the patient on regions \( R_l \).
Then, the next challenge is to use all these images together to compute a locally most similar template for registration. It is built as an analogy to the Frankenstein's creature, i.e. putting together parts coming from different images into one single template. From a more technical point of view, this is done by extending usual unbiased atlas construction techniques to spatially varying weights between the images. The main iteration pipeline is the following:
- Registration of all images on the current average image
- Computation of a new average from the registered images taking into account the regions on which they are meaningful as weights
- Computing a poly diffeomorphisms from the non linear deformations and the weights, and applying its inverse to the new average.
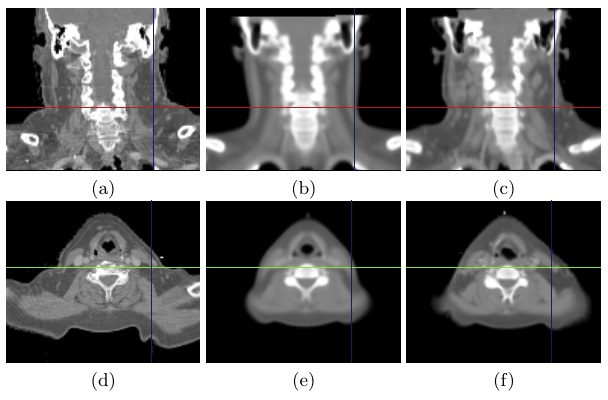
Thanks to this framework we have built for each tested patient a Frankenstein's creature, one of them illustrated in Fig. 3 along with the average atlas. This shows that the locally most similar template is very similar to the patient to be delineated after only an affine registration.
|
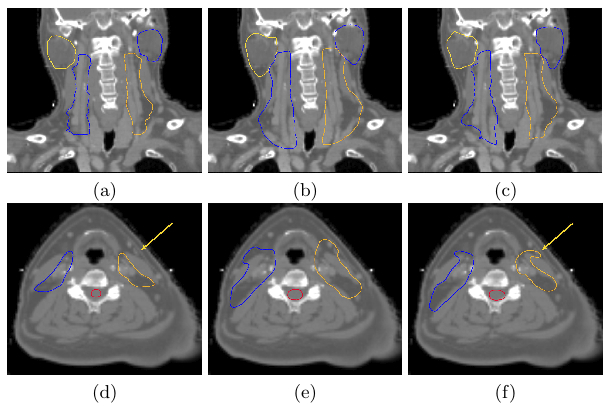
Finally, we evaluated visually (see Fig. 4) and quantitatively the results of the Frankenstein's creatures. Visually the results are much better, allowing for more accurate segmentations when compared to average atlas segmentations. The quantitative results confirm a large reduction of over-segmentation which translates in a large increase of the specificity.
|
Bibliography
-
Evaluation of atlas construction strategies in the context of radiotherapy planning.
O. Commowick and G. Malandain.
In Proceedings of the SA2PM Workshop (From Statistical Atlases to Personalized Models), held in conjunction with MICCAI 2006. October 2006.
-
Efficient Selection of the Most Similar Image in a Database for Critical Structures Segmentation
O. Commowick and G. Malandain.
In Proceedings of the 10th International Conference on Medical Image Computing and Computer Assisted Intervention (MICCAI'07), Part II, volume 4792 of LNCS, pages 203-210, October 2007.
-
Using Frankenstein's Creature Paradigm to Build a Patient Specific Atlas
O. Commowick, S. K. Warfield and G. Malandain.
In Proceedings of the 12th International Conference on Medical Image Computing and Computer Assisted Intervention (MICCAI'09), Part II, volume 5762 of LNCS, pages 993-1000, September 2009.
